Table of Contents
- Why Football Betting Statistics Matter More Than Opinion
- 1. The 2022/23 Season Backtest: Every Strategy, Same Data
- 2. The Effect of Staking: Flat vs. Proportional vs. Kelly
- 3. Lay the Draw: Why the Numbers Look Bad (and How to Fix Them)
- 4. Away Win Lay: The Overlooked Strategy
- 5. Under 2.5 Goals: The Time-Decay Play
- 6. Draw Statistics: What the Data Tells Football Traders
- 7. Run Your Own Football Backtests
- Key Takeaways
- Data Source & Disclaimer
- See Also
Why Football Betting Statistics Matter More Than Opinion
Most football trading content is built on anecdote: strategies that "feel" like they work, rules passed around in forums, and cherry-picked examples. Real football betting statistics change the conversation — they show you exactly what happened when a strategy was applied to every qualifying match over multiple seasons, with no selection bias.
The data in this guide comes from the Ask Bob backtest engine: 8,982 matches from 2020 to 2025, covering top European leagues with full match results, over/under markets, and correct score data. Match data is sourced from API-Football (api-football.com) — this is not Betfair exchange data and is published under no Betfair licence. Backtested odds are market prices from third-party providers and will differ from actual Betfair exchange prices. Where relevant, we link to the corresponding BF Bot Manager automation guides.
Hypothetical results only. All Ask Bob backtest figures are simulated on historical data — they show what would have happened under the stated rules and assumptions, not actual trading outcomes. Past backtested performance does not guarantee future results. Real returns will differ due to commission, slippage, liquidity, odds differences, and changing market conditions. For educational and research purposes only.
1. The 2022/23 Season Backtest: Every Strategy, Same Data
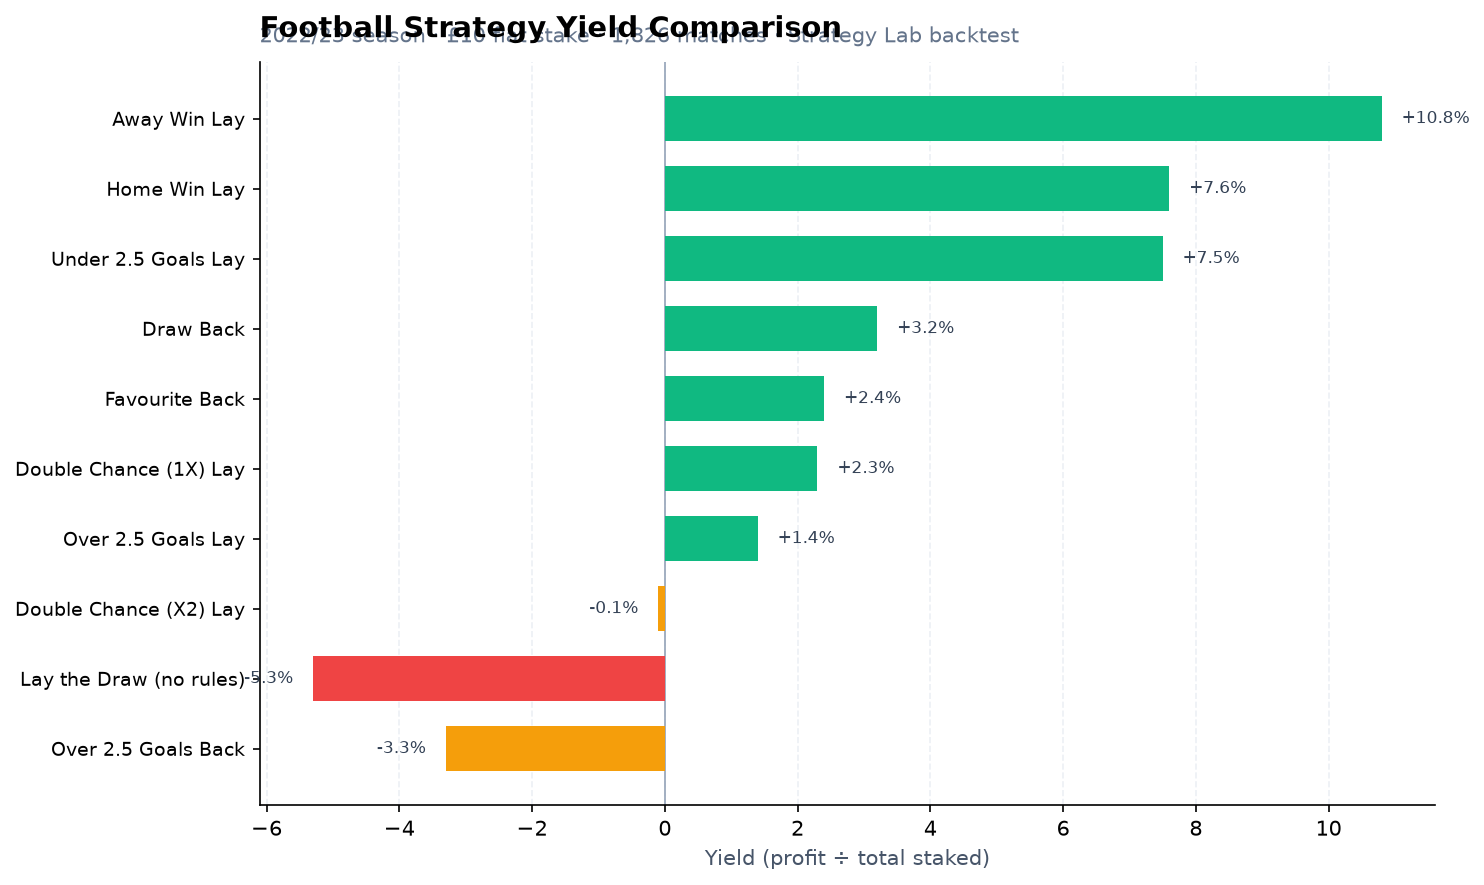
The most useful way to compare strategies is to run them all through the same dataset at the same time. The Ask Bob backtest engine did exactly this — 1,826 qualifying matches from the 2022/23 season, every match with full results, £10 flat stake, Lay direction unless stated, no commission. Yield = profit ÷ total staked — the standard betting industry metric (e.g. £1,307 ÷ £17,520 = 7.5%):
| Strategy | Direction | Bets | P/L (£10 flat) | Yield |
|---|---|---|---|---|
| Away Win Lay | Lay | 1,748 | +£1,885 | +10.8% |
| Home Win Lay | Lay | 1,745 | +£1,322 | +7.6% |
| Under 2.5 Goals Lay | Lay | 1,752 | +£1,307 | +7.5% |
| Draw Back | Back | 1,752 | +£559 | +3.2% |
| Favourite Back | Back | 1,744 | +£422 | +2.4% |
| Double Chance (1X) Lay | Lay | 1,717 | +£399 | +2.3% |
| Over 2.5 Goals Lay | Lay | 1,752 | +£243 | +1.4% |
| Double Chance (X2) Lay | Lay | 1,734 | –£25 | –0.1% |
| Lay the Draw (no rules) | Lay | 1,752 | –£936 | –5.3% |
| Over 2.5 Goals Back | Back | 1,752 | –£582 | –3.3% |
Source: Ask Bob backtest engine (hypothetical simulation). Data: API-Football (api-football.com) — not Betfair exchange data. Season: 2022/23. Stake: £10 flat. Commission: 0% (deduct your exchange rate for net yield). Lay odds use a 2% spread above back odds. 1,826 qualifying matches. Full dataset: 8,982 matches (2020–2025). Past simulated results do not guarantee future performance.
Yield = profit ÷ total staked · same methodology as Ask Bob football backtests
Several things stand out:
- Away Win Lay leads at +10.8% yield — a structurally sound result driven by persistent home advantage. 10.8% yield over ~1,750 bets is a meaningful, sustained edge, not a small-sample anomaly.
- Lay the Draw (unmanaged) shows –5.3% yield — a systematic loser when held to settlement. Active green-up and stop-loss rules are what make it a valid trading strategy.
- Draw Back at +3.2% yield — quietly positive, suggesting draw pricing is occasionally inefficient in certain conditions.
- Over 2.5 Back at –3.3% while Over 2.5 Lay is +1.4% — the market slightly overpriced over-goal probability in this dataset and period.
2. The Effect of Staking: Flat vs. Proportional vs. Kelly
The same Under 2.5 Goals Lay strategy produces very different capital outcomes depending on how you size stakes — all starting from a £1,000 bankroll:
| Staking Method | Bets | P/L | Flat yield equivalent | Notes |
|---|---|---|---|---|
| Flat £10 stake | 1,752 | +£1,307 | +7.5% yield | Standard; easiest to verify |
| Proportional 2% bankroll | 1,752 | +£8,038 | Variable (compounding) | Stakes grow with bankroll |
| Quarter-Kelly sizing | 1,114 | +£56,609 | Variable (compounding) | Fewer, edge-weighted bets |
The flat stake result is the only one directly comparable to an industry yield figure (7.5%). The proportional and Kelly results are compounded capital growth from a £1,000 starting bankroll — they look dramatic because the stake grows with each win. In practice, sequence matters: a different run order of the same results could produce a very different compounded figure. The flat-stake yield of 7.5% is the number to build strategy decisions around. Pre-commission; at 5% exchange commission, flat yield drops to approximately +7.1%.
The key takeaway: staking method matters as much as strategy selection. A mediocre strategy with proportional staking can outperform an excellent strategy with flat staking over time, purely through compounding.
3. Lay the Draw: Why the Numbers Look Bad (and How to Fix Them)
The –£936 Lay the Draw result deserves a full explanation because LTD remains one of the most popular Betfair football strategies.
The backtest result assumes you hold the lay position until settlement. The draw settles as a win or loss at full time. Naturally, draws happen roughly 25–28% of the time in top European football — so laying every draw at average odds of ~3.3 produces an expected loss per bet that reflects the margin priced into the market. These odds are sourced from API-Football and represent the market price, not necessarily the exact Betfair exchange price at the time of the match.
What the backtest does not capture is the in-play price movement: when a goal is scored, draw odds immediately spike to 8.0, 12.0, even 20.0+. A trader who greens up at that moment locks in a profit and does not hold to settlement. The final score is irrelevant.
In short: LTD is a trading strategy, not a betting strategy. The settlement price is not the exit point. The data shows what happens if you ignore this — and why automation is the difference:
| Approach | Result |
|---|---|
| Lay draw, hold to settlement | –£936 (systematic loser) |
| Lay draw, green up on first goal | Profitable (dependent on odds and timing) |
| Lay draw, green up + stop-loss at minute 30 | Most consistent risk-managed approach |
Full Lay the Draw guide including automation setup →
Automate green-up and stop-loss with BF Bot Manager
Configure BF Bot Manager to green up the moment a goal is detected and apply a time-based stop-loss if no goal arrives by minute 30. This is what turns LTD from a loser into a strategy.
Affiliate link — we may earn a commission at no extra cost to you. Full disclosure
4. Away Win Lay: The Overlooked Strategy
Away Win Lay is the highest-performing strategy in our dataset — +£1,885 on 1,748 bets at flat £10 stake. Yet it receives far less attention than Lay the Draw or Over/Under strategies.
The logic is structural: you win when either the home team wins or the match ends in a draw. Given that home advantage still means the home team wins roughly 45% of matches and draws account for ~27%, you are laying against a 28% probability — the away win — which is correctly priced at roughly 3.5 on average. Laying at these prices, with proper liability management, produces a positive expectancy in many leagues.
It is not a universal edge — league selection matters. Leagues with stronger home advantage (Germany Bundesliga, Scottish Premiership) tend to show better results for Away Win Lay than leagues where away wins are more frequent (La Liga, Ligue 1). The Ask Bob backtests page lets you filter by league to identify where this edge is strongest.
5. Under 2.5 Goals: The Time-Decay Play
Under 2.5 Goals is the most reliable strategy in the dataset for consistent flat-stake profit. The simulated +£1,307 result (+7.5% yield on turnover, 1,752 bets) reflects the time-decay mechanism: as a goalless match progresses, the probability of a third goal decreases, and Under 2.5 odds shorten predictably. This is a historical backtest only — not a guarantee of future returns.
Key statistics from the dataset:
- Matches ending with 0–2 goals: approximately 52–55% of top-flight European fixtures
- Average Under 2.5 starting odds: roughly 1.55–1.75 in top leagues
- The positive ROI on laying Under 2.5 (not backing) reflects that the market slightly overprices low-scoring outcomes in certain conditions
The BF Bot Manager Under 2.5 Goals automation guide covers the exact entry trigger, profit exit, and stop-loss rules to replicate this edge systematically.
6. Draw Statistics: What the Data Tells Football Traders
The simulated Draw Back result (+£559, +3.2% yield) is one of the more surprising findings. Blindly backing every draw in the 2022/23 season returned a small hypothetical positive before commission — suggesting that draw probability may occasionally be underpriced relative to the true rate in the API-Football odds dataset. This is not a guarantee of future edge.
This has practical implications:
- For LTD traders: The draw is not worthless as a position. A draw-back hedge on selected low-probability draws can reduce overall portfolio variance.
- For value bettors: Certain conditions (evenly-matched teams, defensive managers, late-season fixtures) produce more draws than the market anticipates. Filtering by these conditions should improve draw-backing ROI.
- Correct score 0-0: The 0-0 draw market is separately available on Betfair. It attracts specific interest as an LTD insurance play — see the correct score insurance guide.
7. Run Your Own Football Backtests
The statistics above apply to unfiltered, all-matches results. Your edge comes from the filtering layer — restricting to specific leagues, odds ranges, team types, or seasonal patterns where the base rates are more favourable.
Ask Bob football backtester lets you:
Backtest: Lay the Draw → · Lay the Draw backtest →
- Filter by league, season, and date range
- Filter by team (home or away)
- Test all 12 strategy selections (Home Win, Draw, Away Win, Over/Under 2.5, BTTS, Correct Score, Double Chance)
- Compare Back vs. Lay direction
- Apply flat, proportional, or Kelly staking
- Add recovery methods (cool-off after losing run)
This is the same engine that produced the results in this guide. Run your filtered hypothesis before committing real money to it.
Key Takeaways
- Lay the Draw without rules loses consistently. The strategy only works with automated green-up on goal and time-based stop-losses.
- Away Win Lay is the highest flat-stake performer in the 2022/23 dataset — an underrated, structurally-sound strategy.
- Under 2.5 Goals Lay provides the most consistent risk-adjusted result for traders wanting predictable time-decay profits.
- Staking matters as much as strategy. Proportional and Kelly staking dramatically amplify winning strategies through compounding.
- Draw pricing is imperfect. Draw Back showed positive ROI in 2022/23 — the market occasionally underprices draws.
- Data without filtering is a starting point, not an edge. League, team, and conditions filters are where systematic edges are found.
Data Source & Disclaimer
Match data: API-Football (api-football.com) — an independent sports data provider. This is not Betfair exchange data; no Betfair API licence is held or required for this dataset. Odds used in backtests are market prices from API-Football and third-party aggregators; actual Betfair exchange prices will differ.
Backtest methodology: All results are hypothetical simulations using the Ask Bob backtest engine. Figures represent what would have happened had the specified stake been placed on every qualifying match meeting the entry conditions. They are not actual trading records. No execution slippage, market impact, or liquidity constraints are modelled. Real-world results will differ and may be worse.
Commission: All profit figures are pre-commission. Apply your exchange's commission rate (typically 5% on net winnings) to calculate net profit. Discount rates for high-volume traders will improve these figures.
Disclaimer: Ask Bob backtest and statistics results are hypothetical and cannot guarantee future performance or profit. Football trading and betting carries financial risk and you may lose more than you stake. This guide is for educational purposes only and does not constitute financial advice. Always trade and bet responsibly within your means.
See Also
Automate this with BF Bot Manager
Betfair-certified automation — Lay the Draw, horse racing, dutching, goals markets and more. No coding. From £29.95/month or £119.95/year after a 7-day free trial.
Affiliate link — we may earn a commission at no extra cost to you. Full disclosure
Run bots 24/7 on a VPS
Low-latency hosting keeps BF Bot Manager and other software online when your PC is off. See our VPS guide for setup notes.
Affiliate link — we may earn a commission at no extra cost to you. Full disclosure