Table of Contents
- Why Horse Racing Statistics Matter for Trading
- 1. Volume: Races and Runners (2021–2026)
- 2. Favourite Win Rate: The Most-Quoted Horse Racing Statistic
- 3. SP Band ROI: Why Blind Backing Loses Money
- 4. Top Courses by Volume
- 5. Discipline Breakdown
- 6. Going Conditions
- 7. Jockey Strike Rates and ROI
- 8. Trainer Strike Rates and ROI
- 9. What These Statistics Mean for Your Strategy
- 10. Building a Horse Racing System (2026 workflow)
- 11. Explore the Data Yourself
- Data Source & Disclaimer
- See Also
Related: Trading horses pre-race · Backtest a horse racing system (Ask Bob) · Automate with BFBM
Why Horse Racing Statistics Matter for Trading
Horse racing statistics are the backbone of any evidence-based approach to Betfair trading or betting. Without data, you are pattern-matching on anecdote — with it, you can identify exactly where the market is correctly priced and where it is not.
The figures in this guide come from the Ask Bob backtest dataset: 65,260 UK and Ireland races across 2021–2026, covering 612,744 runner starts. This is not a sample — it is the full fixture list for GB and IRE over five years.
Where the data has direct implications for automation, we link to the relevant BF Bot Manager strategy guides.
Hypothetical results only. All Ask Bob backtest figures are simulated on historical data — they show what would have happened under the stated rules and assumptions, not actual trading outcomes. Past backtested performance does not guarantee future results. Real returns will differ due to commission, slippage, liquidity, odds differences, and changing market conditions. For educational and research purposes only.
1. Volume: Races and Runners (2021–2026)
The UK and Ireland fixture list has remained broadly stable over five years. Volume dipped slightly from 2021 to 2023, then recovered in 2025:
| Year | Races | Runners |
|---|---|---|
| 2021 | 13,374 | 128,518 |
| 2022 | 13,096 | 121,238 |
| 2023 | 12,898 | 121,203 |
| 2024 | 12,879 | 122,254 |
| 2025 | 13,013 | 119,531 |
| Total | 65,260 | 612,744 |
Average field size: 9.4 runners per race. This affects market liquidity and how much weight to give favourite win rates — smaller fields skew results towards shorter-priced runners.
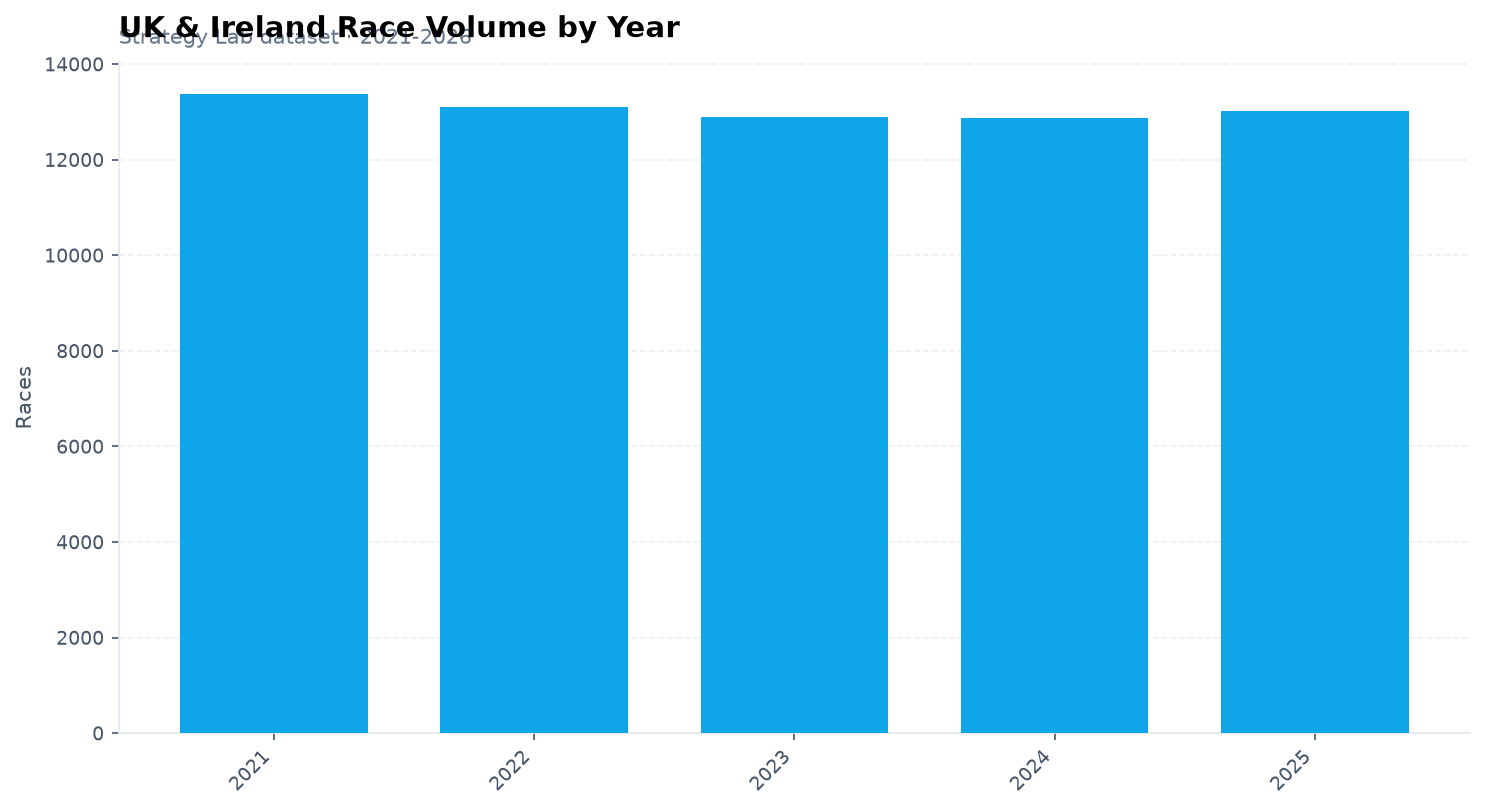
Source: Ask Bob backtests · UK & Ireland · 2021–2025
2. Favourite Win Rate: The Most-Quoted Horse Racing Statistic
The favourite wins 35.1% of races in UK and Ireland. This is one of the most stable figures in racing — but it masks significant variation:
- Flat racing favourites win more often than jump racing favourites
- Small fields (fewer than 6 runners) see favourite win rates above 45%
- Heavy going reduces favourite win rates as the form book becomes unreliable
- All-weather favourites (Wolverhampton, Lingfield, Kempton) are more consistent than turf favourites
Key figures from 60,533 favourite runners across 65,260 races:
- Favourite win rate: 35.1%
- Favourite wins: 21,270
- Implied market price accuracy: well-calibrated (SP matches win rate closely)
What this means for trading: the market prices favourites fairly accurately on average. The edge is not in blindly backing or laying favourites — it is in identifying specific conditions where the market under or overestimates probability. That requires filtering, which is exactly what the Ask Bob backtests page is designed for.
Same chart as Ask Bob backtests → Market & Odds · bar colour = SP ROI at £1 level stakes
3. SP Band ROI: Why Blind Backing Loses Money
The most important table in this guide. Backing every horse in a given odds range — no selection, no filtering — produces a negative ROI at every price point:
| SP Band | Runners | Win Rate | Place Rate | Profit (£1 level stakes) | ROI |
|---|---|---|---|---|---|
| 0–2 (odds-on) | 10,740 | 59.5% | 90.2% | –£551 | –5.1% |
| 2–4 | 60,020 | 31.4% | 70.9% | –£5,222 | –8.7% |
| 4–6 | 81,025 | 18.5% | 53.5% | –£10,914 | –13.5% |
| 6–10 | 119,792 | 11.2% | 38.8% | –£19,204 | –16.0% |
| 10–20 | 145,884 | 5.9% | 24.6% | –£32,892 | –22.5% |
| 20+ | 195,267 | 1.6% | 9.0% | –£88,317 | –45.2% |
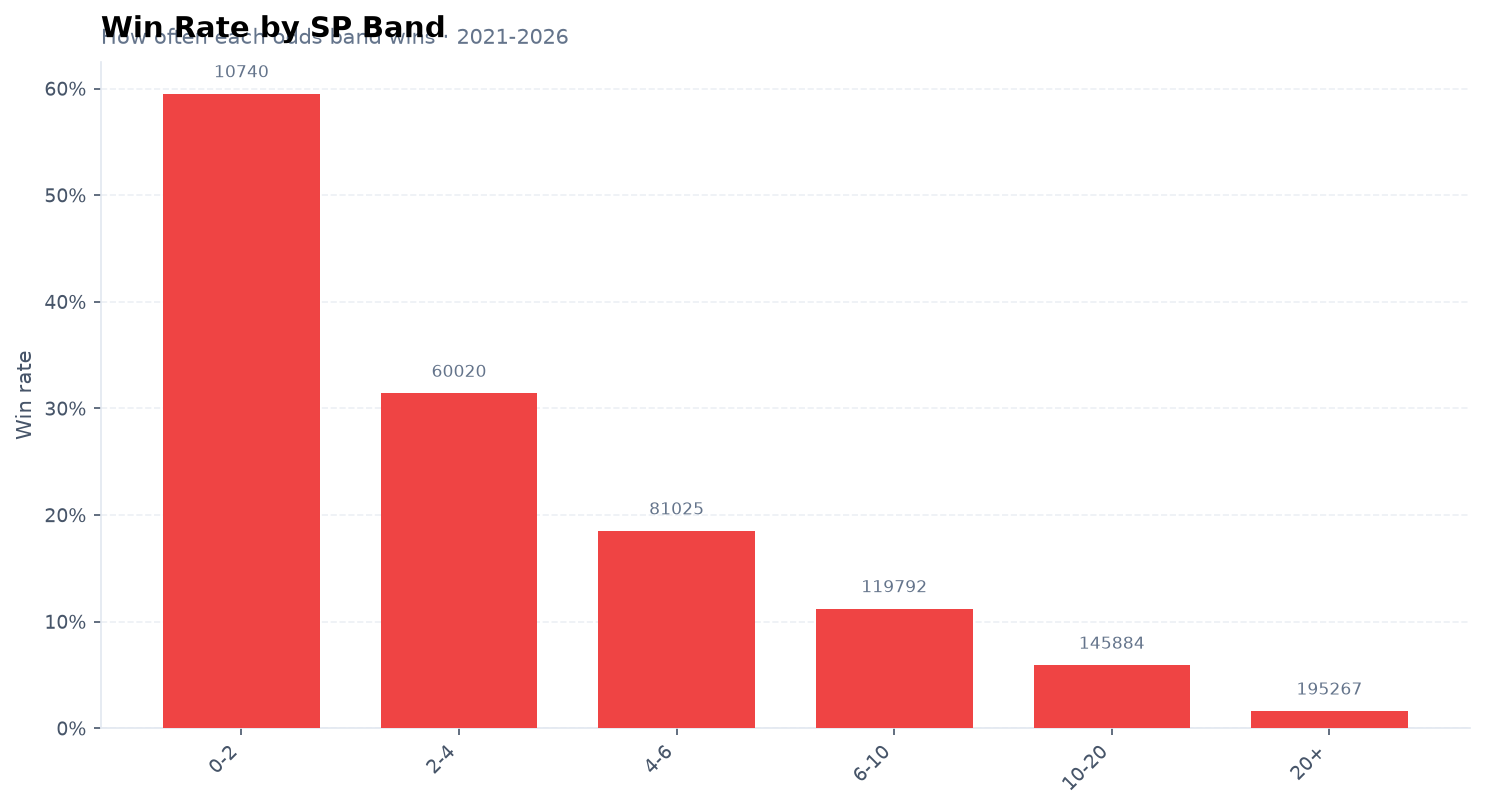
Win rate falls sharply as SP lengthens — labels show runner count per band
Three things stand out:
- Odds-on favourites lose the least (–5.1% ROI at SP), but after applying any exchange commission (typically 5%) the margin is negative — there is no profitable SP band for blind backing.
- Big-price runners (20+) are catastrophically negative (–45.2% ROI). The market significantly overestimates longshot probability due to bookmaker pricing and public bias.
- The 4–6 range is the worst value per bet among medium-priced runners — the market is well-aware these horses win roughly 1-in-5 times and prices them accordingly.
This data is the clearest possible argument for strategy-based selection over blind staking. You need to identify the specific conditions — going, course, trainer, draw, pace scenario — where a horse at 5/1 has a genuine 25%+ chance rather than the market's implied 17%.
Automate your horse racing strategy with data-driven rules
BF Bot Manager lets you build trigger-based rules around price, time, going, BSP and more — turning statistical edges into automated bets across multiple races simultaneously.
Affiliate link — we may earn a commission at no extra cost to you. Full disclosure
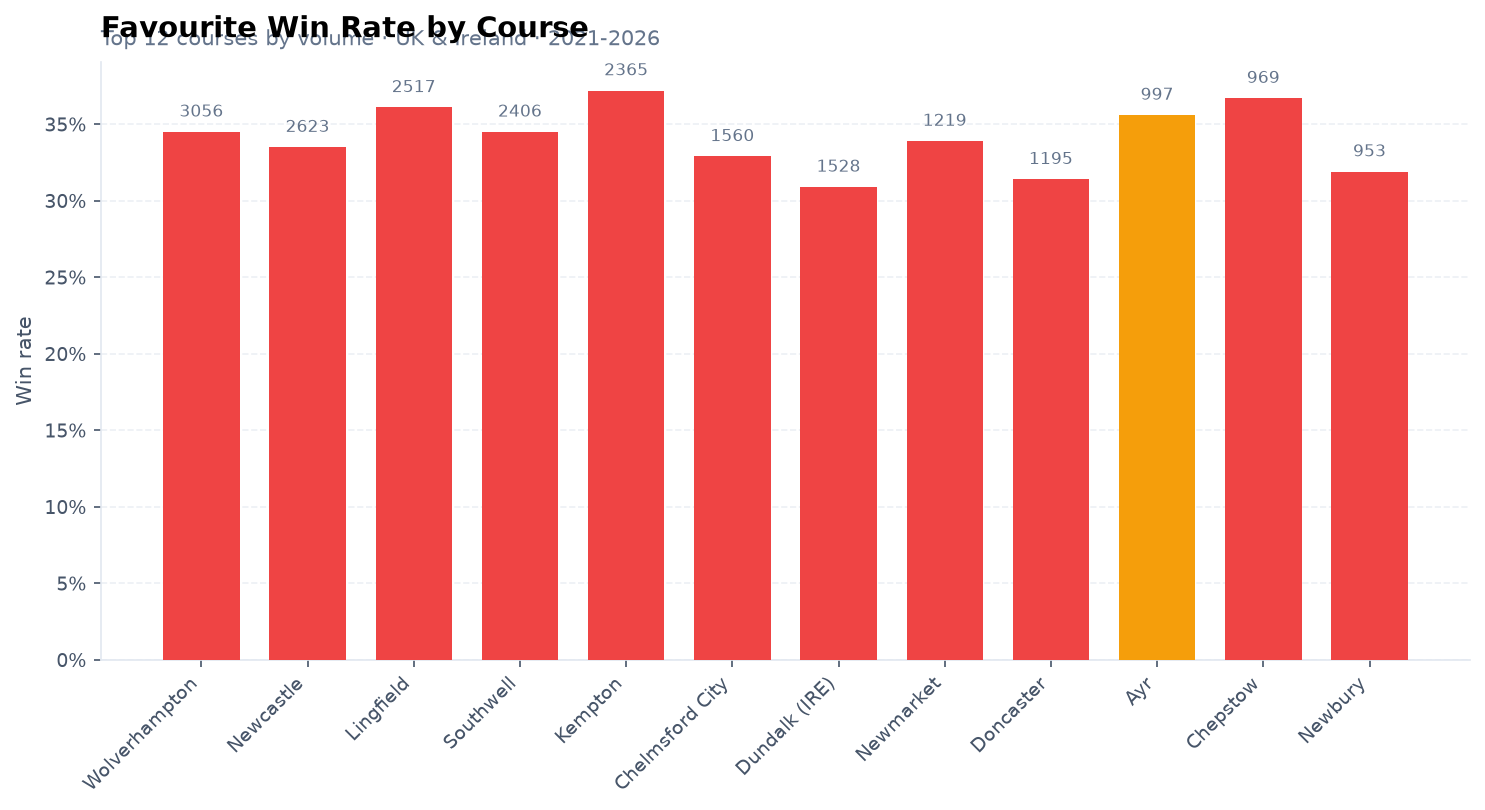
4. Top Courses by Volume
All-weather tracks dominate the volume rankings. This matters for strategy building: if you are backtesting a system or building automation rules, the majority of your sample will come from these venues:
| Course | Races (2021–2026) | Runners |
|---|---|---|
| Wolverhampton | 3,255 | 29,462 |
| Newcastle | 2,839 | 25,951 |
| Lingfield | 2,668 | 22,716 |
| Southwell | 2,582 | 23,427 |
| Kempton | 2,543 | 24,005 |
| Dundalk (IRE) | 1,683 | 19,984 |
| Chelmsford City | 1,673 | 14,687 |
| Newmarket | 1,328 | 11,640 |
| Doncaster | 1,289 | 11,823 |
| Ayr | 1,062 | 9,397 |
| Newbury | 1,040 | 9,807 |
| Haydock | 1,031 | 8,504 |
| Chepstow | 1,027 | 8,966 |
| Curragh (IRE) | 912 | 12,003 |
| Catterick | 886 | 7,498 |
Wolverhampton alone accounts for 5% of all UK and Ireland races. Traders targeting all-weather markets should note that Wolverhampton, Newcastle and Lingfield collectively represent roughly 13% of the full fixture list — significant enough to build venue-specific strategies.
5. Discipline Breakdown
Flat racing dominates, accounting for nearly two-thirds of all fixtures:
| Discipline | Races | Runners | Share |
|---|---|---|---|
| Flat | 40,446 | 383,692 | 62% |
| Hurdle | 14,795 | 148,427 | 23% |
| Chase | 9,094 | 70,752 | 14% |
| NH Flat (Bumper) | 925 | 9,873 | 1% |
Chase races have smaller fields on average (7.8 runners) than Flat (9.5) or Hurdles (10.0). This has implications for market liquidity — Chase markets are typically thinner, which affects pre-race trading strategies.
6. Going Conditions
Soft ground is the most common going in the UK and Ireland — accounting for a third of all races. This reflects the British climate and the predominance of winter jumps racing:
| Going Group | Races | Share |
|---|---|---|
| Soft | 21,481 | 33% |
| Standard (AW) | 15,332 | 24% |
| Good | 12,603 | 19% |
| Firm | 11,660 | 18% |
| Heavy | 4,184 | 6% |
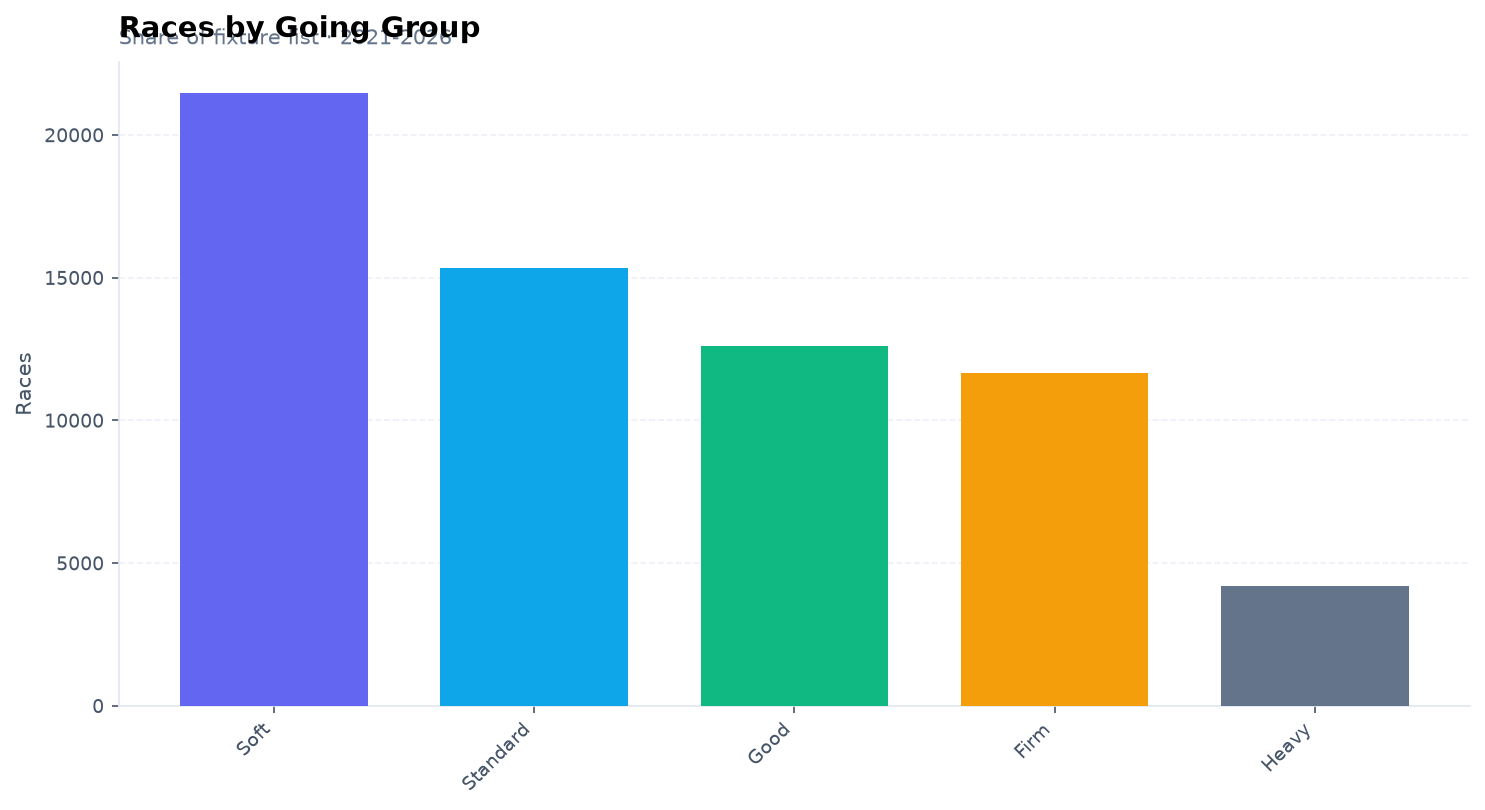
For strategy building, the practical split is: all-weather (Standard, 24%) versus turf (76%). All-weather markets behave differently — more consistent fields, lower going variance, and higher liquidity on the main tracks. Automation strategies often perform differently on AW vs. turf and should be backtested separately.
7. Jockey Strike Rates and ROI
Strike rate and ROI tell different stories. High ROI jockeys often ride for small stables with large-priced winners — not necessarily consistent enough to follow systematically. The most useful column for strategy building is ROI with a minimum of 50+ runs:
| Jockey | Runs | Wins | Strike Rate | ROI |
|---|---|---|---|---|
| Michael Kenneally | 126 | 15 | 11.9% | +174.6% |
| Mr Murray Dodd | 58 | 10 | 17.2% | +177.5% |
| Mr P J Cody | 66 | 3 | 4.5% | +181.8% |
| Mr C J Shine | 138 | 8 | 5.8% | +196.4% |
| Mr B J Walsh | 77 | 5 | 6.5% | +137.3% |
| Stan Sheppard | 1,084 | 177 | 16.3% | +9.7% |
Stan Sheppard is the most statistically reliable name here — 1,084 runs provides a meaningful sample, and a +9.7% ROI over that volume is genuinely significant. The high-ROI jockeys with small samples (50–150 runs) should be treated with more caution; a handful of big-price winners distorts their figures.
Important note on ROI interpretation: these are SP-based ROIs to £1 level stakes, sourced from RacingFormBook — not Betfair exchange data. Betfair exchange prices frequently differ from SP (sometimes better, sometimes worse). Exchange commission (typically 5%) applies to profits on top of any SP-based ROI figures. A jockey showing +10% SP ROI may approach break-even or slightly lose after exchange commission is applied.
8. Trainer Strike Rates and ROI
| Trainer | Runs | Wins | Strike Rate | ROI |
|---|---|---|---|---|
| E McNamara | 877 | 85 | 9.7% | +13.5% |
| Mrs H Main | 546 | 58 | 10.6% | +20.2% |
| Mrs S J Humphrey | 318 | 45 | 14.2% | +38.3% |
| John Riches | 229 | 20 | 8.7% | +47.6% |
| C W Fairhurst | 187 | 15 | 8.0% | +63.7% |
| Miss Martin | 157 | 16 | 10.2% | +113.6% |
| D Leahy | 74 | 3 | 4.1% | +196.6% |
E McNamara (877 runs, +13.5% ROI) is the standout name for systematic following — the sample size is large enough to be meaningful. Mrs S J Humphrey at 318 runs and +38.3% ROI is also worth noting. As with jockeys, small-sample trainers with large ROIs are mostly driven by a few big-priced winners.
9. What These Statistics Mean for Your Strategy
Five practical conclusions from five years of data:
- Blind backing loses at every price point. The ROI table is proof. You need selection criteria — going, course, discipline, trainer form, draw bias — to identify where the market is mispriced.
- All-weather dominates volume. If your system is not tested on Wolverhampton, Newcastle and Lingfield, it is not fully tested. AW and turf behave differently; split your analysis.
- Favourite win rate (35.1%) is stable but not the whole story. At 4/5 (1.80), the implied probability is 56%. Favourites win only 35% of races. Laying favourites blindly in the 1.6–2.0 range has historically positive expected value — but commission and variance make it work best with systematic selection.
- Soft ground increases uncertainty. 33% of all races run on Soft — the going condition with the highest variance in outcomes. Form horses that thrive on Good to Firm can dramatically underperform on Soft, which disrupts market pricing.
- Data needs a tool to be actionable. Raw statistics tell you what happened. The Ask Bob backtests page lets you combine filters — course × going × discipline × odds band — to find where specific conditions consistently beat the market.
Turn these statistics into automated rules
BF Bot Manager can automate entries based on SP range, going conditions, time before race, and price movement. Build rules around the edges this data reveals.
Affiliate link — we may earn a commission at no extra cost to you. Full disclosure
10. Building a Horse Racing System (2026 workflow)
A horse racing system is a repeatable set of rules — not a tipster's hunch. The workflow most UK exchange traders use in 2026:
- Pick a niche — e.g. all-weather handicaps at Wolverhampton, favourites in the 2.0–4.0 SP band, or pre-race steamers (see our pre-race trading guide).
- Filter on data — use the course and going tables in this post, or filter live in Ask Bob (65k+ races, 2021–2026).
- Backtest rules — paste your entry criteria into Ask Bob and run a Strategy Snapshot or full backtest with your staking plan (5 free runs per day).
- Trade or automate — manual pre-race scalping on Betfair, or deploy rules in BF Bot Manager once results look stable over hundreds of races.
Reality check: blind backing of favourites loses at every SP band in our dataset — profitable systems need filters (course, going, field size, time to off). That is why backtesting beats guessing.
Test your horse racing system on Ask Bob →
11. Explore the Data Yourself
The statistics in this post are drawn directly from the Ask Bob backtests page — a filterable data explorer built on the full UK and Ireland racing results database. You can:
- Filter by date range (e.g. last 12 months vs. 5-year view)
- Compare favourite win rates by specific course
- See how going affects win rates at each track
- Filter by discipline (Flat / Hurdle / Chase / NH Flat)
- View jockey and trainer ROI with minimum sample size controls
Backtest horse strategies with Ask Bob → · Back favourites backtest →
Data Source & Disclaimer
Source: RacingFormBook (racingformbook.com), via the Ask Bob. RacingFormBook is an independent UK horse racing results database — this is not Betfair exchange data and is published under no Betfair licence. Scope: UK (GB) and Ireland (IRE) races only. Period: January 2021 to December 2025.
ROI figures are calculated to £1 level stakes at Starting Price (SP) — the official price returned by the race. SP and Betfair exchange prices differ; actual exchange ROI will vary depending on the price you achieve and whether you use BSP (Betfair Starting Price) or manual entry. Betfair's standard commission (typically 5%) is not deducted from these figures; apply your commission rate to any positive ROI before drawing conclusions.
Disclaimer: All Ask Bob backtest statistics and ROI figures are derived from historical race results and are hypothetical research data — they illustrate past patterns only and cannot guarantee future performance or profit. Horse racing is inherently unpredictable and all trading and betting carries financial risk. This data is provided for educational and research purposes only and does not constitute financial advice. Always bet and trade responsibly.
See Also
Automate this with BF Bot Manager
Betfair-certified automation — Lay the Draw, horse racing, dutching, goals markets and more. No coding. From £29.95/month or £119.95/year after a 7-day free trial.
Affiliate link — we may earn a commission at no extra cost to you. Full disclosure
Run bots 24/7 on a VPS
Low-latency hosting keeps BF Bot Manager and other software online when your PC is off. See our VPS guide for setup notes.
Affiliate link — we may earn a commission at no extra cost to you. Full disclosure